

Home › Install guides › Insights notifications
Install guide · IT teams and MSPsInsights notifications
Turn on the ready-made messages Insights writes (duplex mismatch, rogue DHCP, disks, links, sign-in attempts, network trends like loops and flapping links, and more), pick where each goes, list your trusted sources, and add the rogue DHCP check.
Uplivra Technologies LLC · Guide for Uplivra 26.10 · Updated 4 October 2026 · Latest version: https://uplivra.com/guides/insights-notifications.html
What you need
- Uplivra 26.10.25 or later (the search, filters and wizards: 26.10.26).
- Somewhere to send messages: Settings › Where alerts go (email, Teams, Slack or a webhook).
- For duplex, port and link notices: an SNMP check on the switches and routers, with performance on (the default).
- For sign-in attempts and probes: logs from the devices (Network Pro or Log Intelligence), sent to Uplivra by syslog.
- Optional: the rogue DHCP check, below.
Every notice and template on this page is part of Insights, Uplivra's built-in analysis, which comes with Core on every license, including the free one.
Turn on templates
- Open Settings › Insights notifications. The list shows every template with whether it's on, when it sends and where. Search, or narrow it with the drop-downs (on or off, sent when something is found or as a digest, who it's for).
- Click a template to change it. A short wizard opens over the page: tick Send, pick one or more places to send it, and choose the minimum importance: For your information (includes forecasts like "will be full in 9 days"), Attention, or Act now only. For digests, pick the hour (and the day, for the weekly summary).
- Click Save, then Preview to see it as it would arrive, and Send a test to check it reaches you.
Add a notification opens the same wizard with one more step first: search the ready-made messages (duplex, disk, printer, security…), pick one, then choose where it goes and when.
A template sends only findings that are new, or got worse, since it last sent, so turning one on doesn't send everything already open. The Notices page (in the menu under Insights) shows everything open now and what cleared in the last week.
Trusted sources
Sign-in failures and probes from trusted addresses are never reported. Always trusted, automatically:
- every Uplivra collector's own addresses, and the address it connects to the server from;
- the Uplivra server itself.
Optional: add your own under Settings › Insights notifications › Trusted sources: vulnerability scanners, jump hosts, admin networks. One per line, as an address (192.0.2.15) or a network (10.20.0.0/16). A list that would trust everything (0.0.0.0/0) is refused.
By default, repeated sign-in failures and probes from untrusted sources also open an alert, so they reach your usual alert channels, on-call and tickets like any other alert, and close when it stops. Untick the box to only get them through the templates.
| Finding | When |
|---|---|
| Sign-in attempts | 20 or more failed sign-ins (SSH, Telnet, RDP, web admin, VPN) from one untrusted source in an hour. Urgent at 100, or at any count over Telnet |
| Password spraying | 60 or more failures to one device from 5 or more untrusted sources in an hour |
| Probes | 100 or more connections a firewall refused from one untrusted source in an hour |
| Port scan | An untrusted source refused on 10 or more different ports in an hour |
Add the rogue DHCP check (optional)
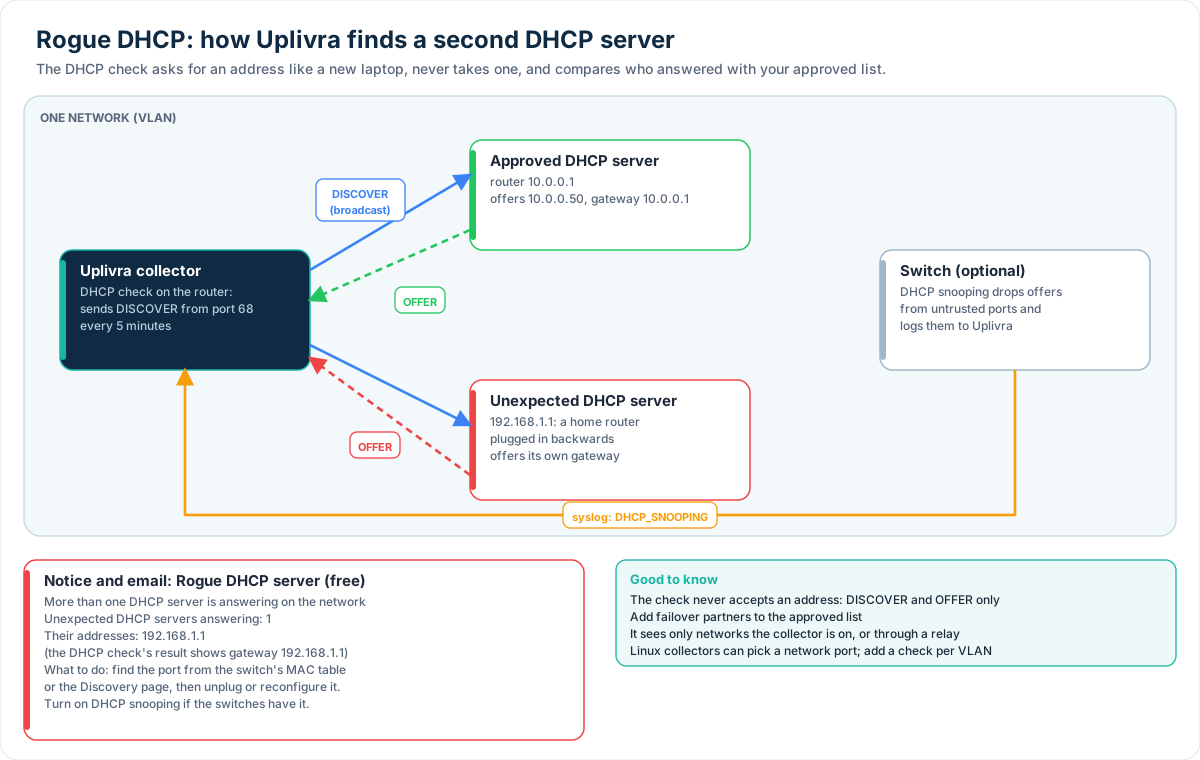
Ports: the check broadcasts on UDP 67 from the collector and hears answers on UDP 68, which firewalls allow as DHCP replies. Nothing to open. Uplivra's own DHCP server never answers it, so it only reports other servers.
- Open the device that is your approved DHCP server (usually the router or firewall, or a Windows server).
- Add a check › DHCP server. In Other approved DHCP servers, list any failover partner.
- Optional: on a Linux collector with several network ports, enter the port to ask on (for example
eth1).
Every 5 minutes the collector asks for an address the way a new laptop would, lists every server that answers, and stops there: it never accepts an address, so no lease is used. An answer from a server that isn't approved turns the check to warning and raises the Rogue DHCP server notice with its address. If your switches do DHCP snooping, their log messages about blocked DHCP replies raise the same notice with the port.
The collector only sees DHCP on networks it's plugged into (or through a DHCP relay). To watch several VLANs, use a collector with a port on each, or one collector per site. The probe wizard and CSV import accept dhcp as a probe.
Duplex mismatch
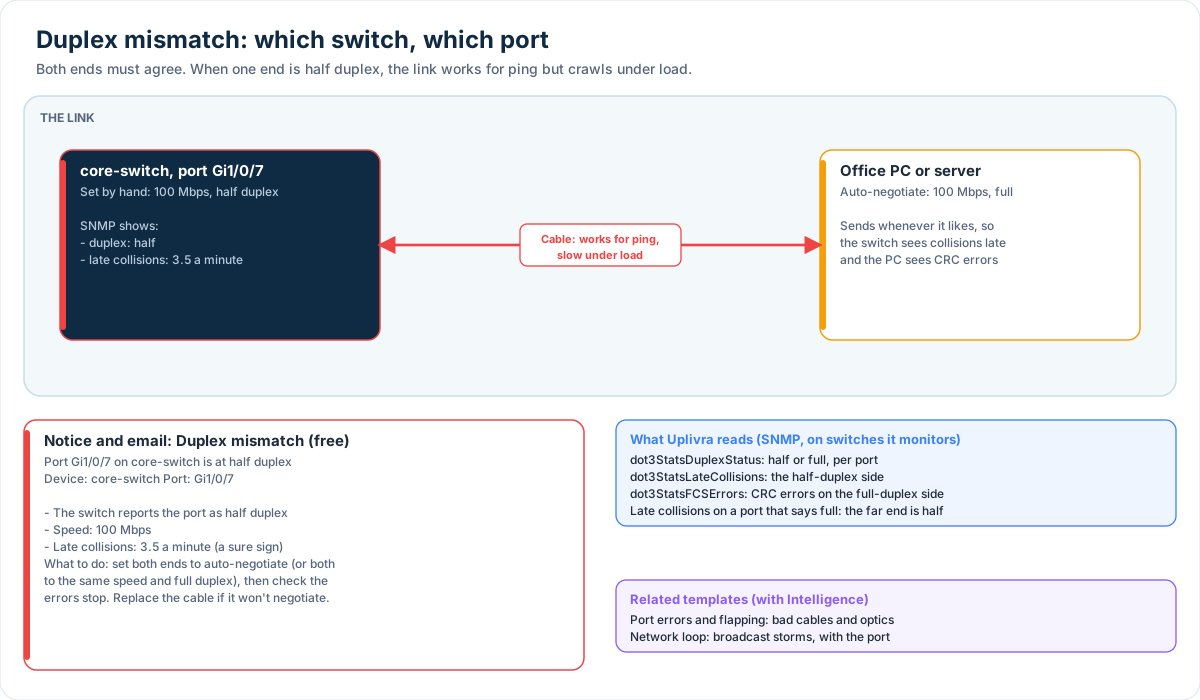
Nothing to set up beyond the SNMP check on the switch. Uplivra reads each port's duplex and its late-collision and CRC error counters. A port at half duplex, or late collisions on a port that says full duplex, raises the notice with the switch and port.
New devices on the network
The New devices on the network template (also part of Security watch) sends, at most once a day, the network adapters Uplivra saw for the first time that aren't among your devices: each one's maker, address, name and switch port. Phones' private (random) addresses are left out, because they change for every network. See MAC addresses and makers for where they come from.
You can also ask on Insights › Ask: "What devices are on my network?", "Any Hikvision devices on the network?" or "Which new devices appeared today?"
Network trends
Insights also lines up what your switches, routers and firewalls report (syslog, SNMP traps, SNMP counters, MAC tables, configuration changes and packet captures) for each device and site, and raises a notice when several signs point at one underlying problem. Nothing extra to set up beyond SNMP checks on the network devices and, for the most detail, their syslog and traps sent to the collector. Turn on the Network trends (loops, flapping, failing links) template to get them by email or chat.
| Trend | What it lines up |
|---|---|
| Network loop | MAC addresses flapping between ports, spanning-tree changes, storm control, broadcasts 5× the usual, discards and the switch's CPU, on one switch within the hour (or the switch's own loop detection). Names the ports and VLAN, and other switches at the site seeing the same |
| MAC address flapping | Flapping messages or MAC-table moves without the other loop signs (often two cables to one server, or roaming) |
| Spanning tree instability | A root bridge change, or 10+ topology changes an hour, with the port causing them when one is flapping |
| Ports shut by the switch | BPDU guard, loop protection, port security and other err-disable reasons, in plain words |
| Link flapping | A port going down 3+ times an hour, with the cause when it lines up: weak optic light, CRC errors, duplex, PoE |
| Cabling or duplex errors | CRC or interface errors rising to 3× the port's usual, with late collisions or duplex mismatch messages |
| Optics losing light | Receive light under −20 dBm, falling steadily over a week, or an optic alarm |
| Routing neighbors dropping | A BGP, OSPF, EIGRP or IS-IS neighbor dropping twice in an hour, with errors on the link, a busy CPU or a full link as the cause |
| Gateway failover | HSRP or VRRP switching back and forth |
| IP conflicts and ARP floods | Two devices using one address (with their MAC addresses), ARP rate exceeded |
| DHCP pool exhausted | "No free leases", "pool is empty", scope full |
| PoE power budget | Power refused to phones, cameras or access points; budget over 90% |
| Fans, power supplies and temperature | Failure messages; temperature 10 °C above usual |
| Firewall session table | Connection table full, conserve mode |
| VPN tunnels dropping | A tunnel to one peer going down twice in an hour, with the internet link's state |
| Network device CPU and memory | CPU 80%+ and well above usual; memory nearly full |
| Congestion drops | Discards 3× usual, on a port that is 80%+ busy |
| TCP retransmissions and out-of-order packets | From packet captures, with errors or drops at the same site as the likely cause |
| Clock synchronisation | NTP lost or clock more than a second out |
Every trend checks for a configuration change on the same device in the hour before and names it as the likeliest cause. A trend replaces the simpler notice it explains (for example a loop replaces the broadcast-storm notice on that switch). They close by themselves when the signs stop.
Notices › Network trends shows the last 24 hours or 7 days by type and by device. You can also ask on Insights › Ask: "Is there a loop?", "Any MAC flapping today?", "Why is the network slow at Clinic-West?". Insights only reports: it never changes a device.
Context on alerts and tickets
Alert messages and tickets get an Insights section automatically: the likely cause, what else happened at the time, log lines, earlier notices and what to check first. Webhooks get the same under context; see Alert webhooks.
Who can change this
Two permissions, under Settings › People and access:
- See Insights notices: Administrators, Operators, NOC engineers and Viewers.
- Choose Insights notification templates: Administrators only, by default.